Vectors of colors for figures
jcolors.RdCreates different vectors of related colors that may be useful for figures.
jcolors(palette = c("default", "pal2", "pal3", "pal4", "pal5", "pal6",
  "pal7", "pal8", "pal9", "pal10", "pal11", "pal12", "rainbow"))
Arguments
| palette | Character string indicating a palette of colors. |
|---|
Value
Vector of character strings representing the chosen palette of colors.
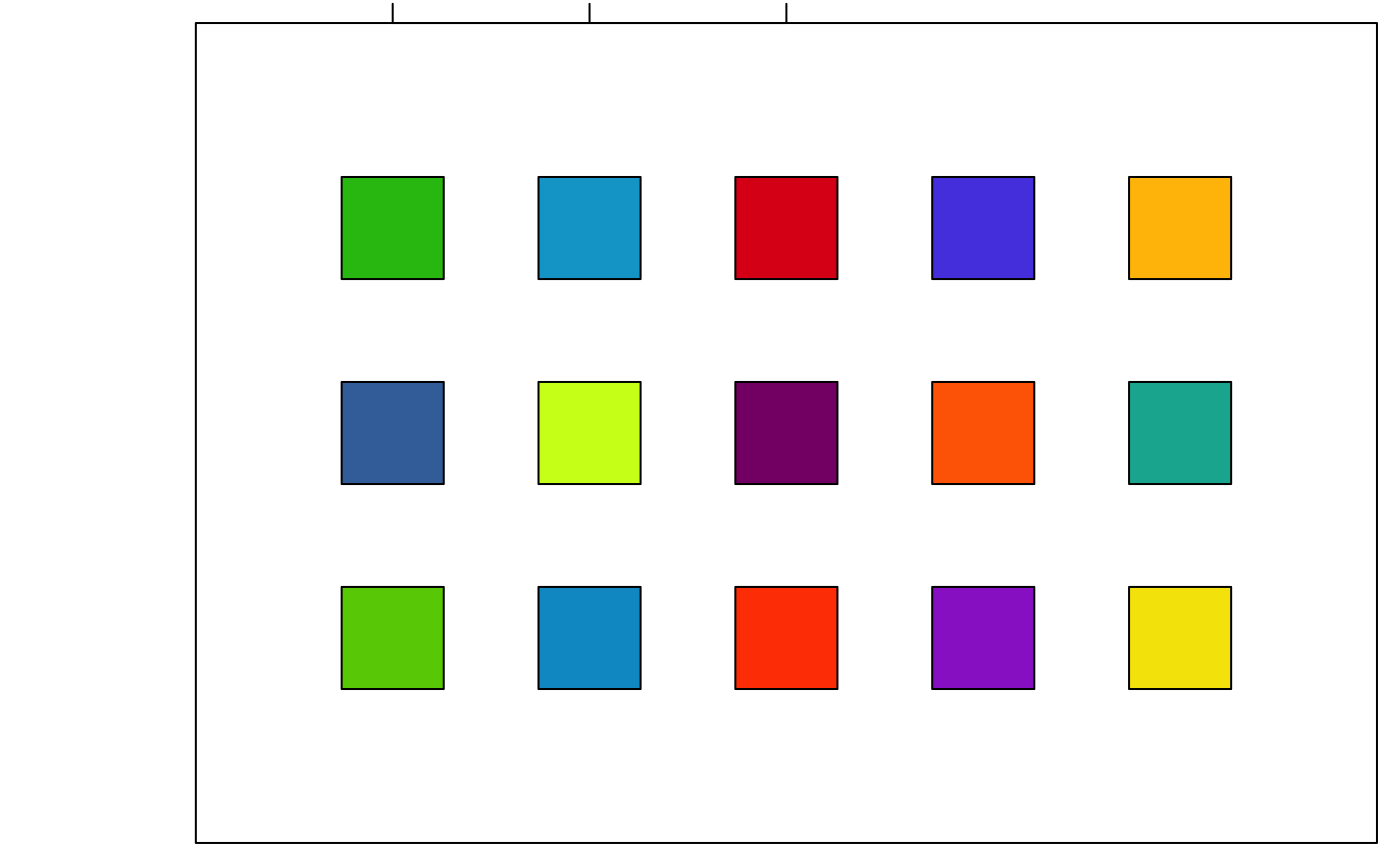
Examples
par(mar=c(0.6,5.1,0.6,0.6)) plot(0, 0, type = "n", xlab = "", ylab = "", xlim = c(0, 6), ylim = c(4, 0), yaxs = "i", xaxt = "n", yaxt = "n", xaxs = "i")def <- jcolors("default") points(seq(along = def), rep(1, length(def)), pch = 22, bg = def, cex = 8)pal2 <- jcolors("pal2") points(seq(along = pal2), rep(2, length(pal2)), pch = 22, bg = pal2, cex = 8)pal3 <- jcolors("pal3") points(seq(along = pal3), rep(3, length(pal3)), pch = 22, bg = pal3, cex = 8)