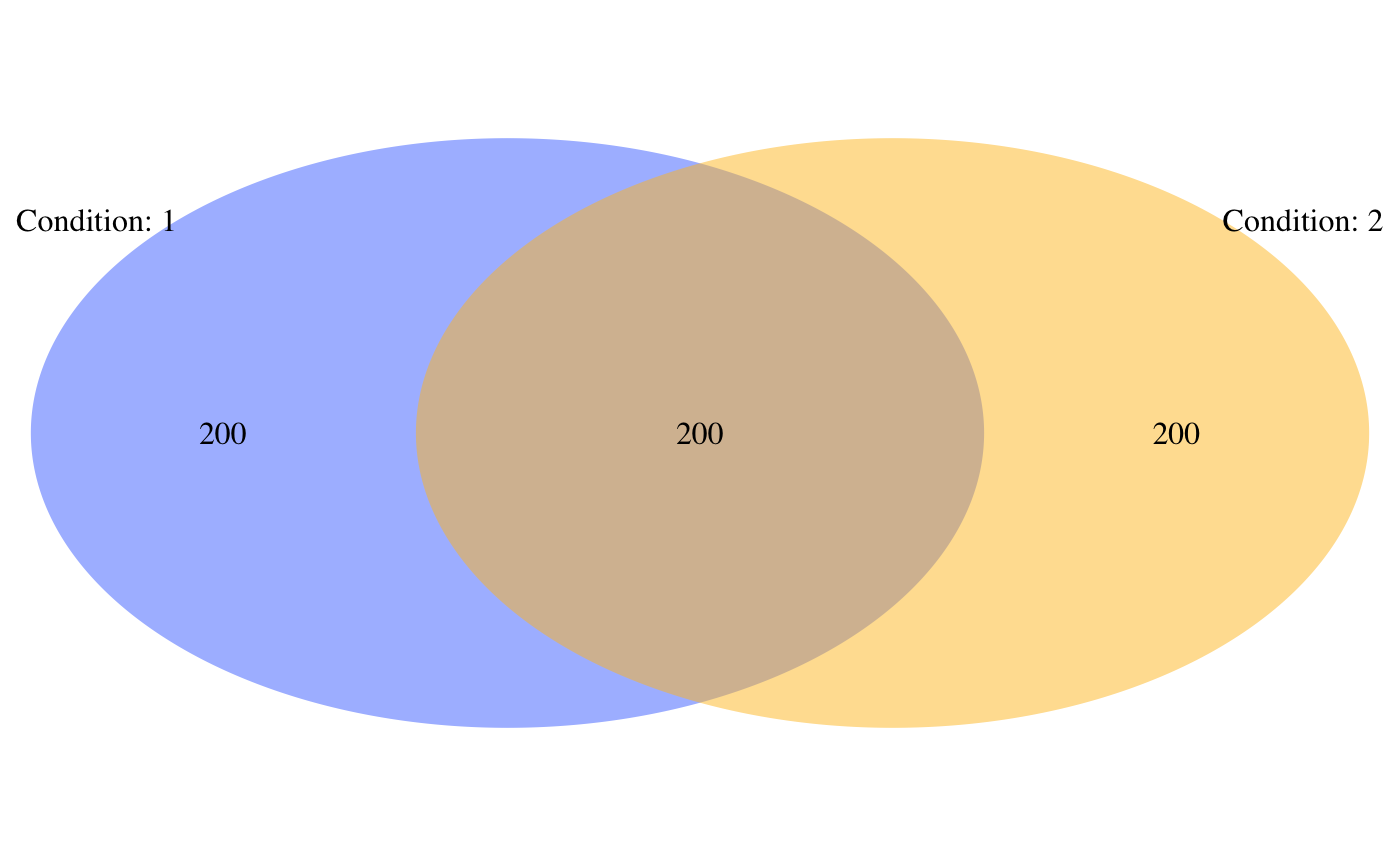
plotting function for venn diagrams of overlapping conditions
plotVenn(
  conditions,
  condition.names = NULL,
  lty = "blank",
  fill.colors = c("royalblue1", "goldenrod1", "mediumvioletred", "turquoise3",
    "firebrick1"),
  ...
)
Arguments
| conditions | condition matrix such as the one given to vennLasso() function. It can have up to 5 conditions |
|---|---|
| condition.names | names of the conditions (equal to the number of columns of conditions) |
| lty | standard 'lty' graphical parameter for line type around circles. default is no lines |
| fill.colors | vector of colors for plotting. Set fill.colors = NULL for no colors |
| ... | other graphical parameters for the plot |
Examples
library(Matrix)

set.seed(123)
n.obs <- 200
n.vars <- 50

true.beta.mat <- array(NA, dim = c(3, n.vars))
true.beta.mat[1,] <- c(-0.5, -1, 0, 0, 2, rep(0, n.vars - 5))
true.beta.mat[2,] <- c(0.5, 0.5, -0.5, -0.5, 1, -1, rep(0, n.vars - 6))
true.beta.mat[3,] <- c(0, 0, 1, 1, -1, rep(0, n.vars - 5))
rownames(true.beta.mat) <- c("1,0", "1,1", "0,1")
true.beta <- as.vector(t(true.beta.mat))

x.sub1 <- matrix(rnorm(n.obs * n.vars), n.obs, n.vars)
x.sub2 <- matrix(rnorm(n.obs * n.vars), n.obs, n.vars)
x.sub3 <- matrix(rnorm(n.obs * n.vars), n.obs, n.vars)

x <- as.matrix(rbind(x.sub1, x.sub2, x.sub3))

conditions <- as.matrix(cbind(c(rep(1, 2 * n.obs), rep(0, n.obs)),
                              c(rep(0, n.obs), rep(1, 2 * n.obs))))

y <- rnorm(n.obs * 3, sd = 3) + drop(as.matrix(bdiag(x.sub1, x.sub2, x.sub3)) %*% true.beta)

fit <- vennLasso(x = x, y = y, groups = conditions)

vennobj <- plotVenn(conditions)
