Plot Cross-Validation Results
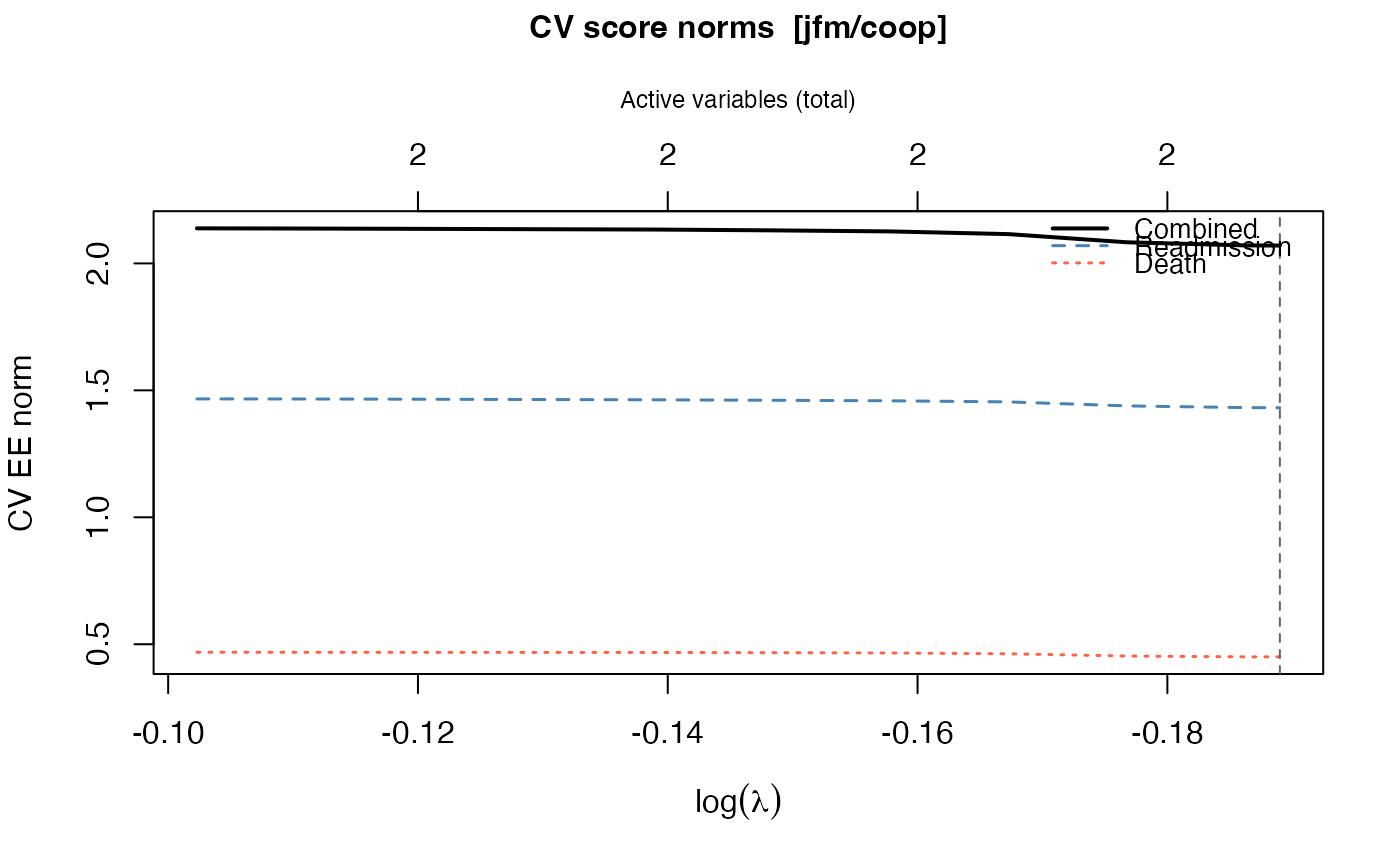
plot.swjm_cv.RdPlots the cross-validated estimating-equation score norms versus \(\log(\lambda)\), with separate lines for the readmission and death components. A vertical dashed line marks the lambda that minimizes the combined norm. The top axis shows the total number of active variables along the path.
Usage
# S3 method for class 'swjm_cv'
plot(x, log_lambda = TRUE, ...)Examples
# \donttest{
dat <- generate_data(n = 50, p = 10, scenario = 1, model = "jfm")
cv  <- cv_stagewise(dat$data, model = "jfm", penalty = "coop",
                    max_iter = 200)
plot(cv)

# }
# }